Our Facts and Figures section gives you lots of ways of putting Ethiopia into a world context. Wherever possible, we make comparisons with Great Britain and the United States in order to clarify matters.

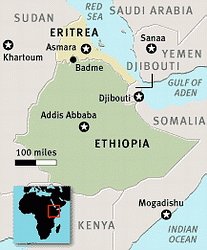
  • The Geography section deals with land area, resources, land use and the environment.
  • Under the heading of People we include population figures, birth and death rates, ethnicity, religions and literacy.
  • We include also some basic facts about the Government and Economy of Ethiopia, its main imports and exports as well as its budget and currency.
  • Finally you will find basic information about the Transport infrastructure of the country.

Much of the information on this page has been taken from the CIA World Fact Book.
If we have omitted any issues of interest in this section, do get in touch with us to let us know and we shall amend matters with haste.

Geography

map

The total area of Ethiopia is approximately five times the size of the UK and just less than twice the size of Texas.

Ethiopia UK USA
Total area of country 1,104,300 sq km 243,610 sq km 9,826,675 sq km
Land area 1,000,000 sq km 241,930 sq km 9,161,966 sq km
Water area 104,300 sq km 1,680 sq km 664,709 sq km

Neighbours

Ethiopia borders on Djibouti and Eritrea in the north, Sudan in the west, Kenya in the south, and Somalia in the east.  The country is therefore completely landlocked.

Ethiopia UK USA
Highest point Mt. Ras Dashen 4,533m Ben Nevis 1,343m Mt McKinley 6,194m
Lowest point Danakil Depression -125m Fens -4m Death Valley -86m

Natural resources of Ethiopia

Gold, platinum, copper, potash, natural gas, hydropower.

Land use

(esitimated 2011) Ethiopia UK USA
Arable land 15.2 % 25.1 % 16.8 %
Permanent crops 1.1 % 0.2 % 0.3 %
Permanent pastures 20 % 45.7 % 27.4 %
Forests and woodland 12.2 % 11.9 % 33.3 %
Other 51.5 % 17.1 % 22.2 %

Natural hazards

Geologically active Great Rift Valley susceptible to earthquakes and volcanic eruptions; frequent droughts.

Volcanic activity in the Great Rift Valley; Erta Ale (elev. 613 m), which has caused frequent lava flows in recent years, is the country’s most active volcano; Dabbahu became active in 2005, forcing evacuations; other historically active volcanoes include Alayta, Dalaffilla, Dallol, Dama Ali, Fentale, Kone, Manda Hararo, and Manda-Inakir.

Environmental problems

Deforestation; overgrazing; soil erosion; desertification; water shortages in some areas from water-intensive farming and poor management.

The World Factbook – Click here for source

Economy

Ethiopia’s economy is based on agriculture, but the government is pushing to diversify into manufacturing, textiles, and energy generation. Coffee is a major export crop. The agricultural sector suffers from poor cultivation practices and frequent drought, but recent joint efforts by the Government of Ethiopia and donors have strengthened Ethiopia’s agricultural resilience, contributing to a reduction in the number of Ethiopians threatened with starvation.

Coffee is Ethiopia’s number one source of export revenue generating about 25-30 percent of the country’s total export earnings. Ethiopia remains the largest producer of coffee in Africa and is the fifth largest coffee producer in the world next to Brazil, Vietnam, Colombia, and Indonesia, contributing about 4.2 percent of total world coffee production. Coffee production is vital to the Ethiopian economy with about 15 million people directly or indirectly deriving their livelihoods from it. Khat production continues to increase at the expense of coffee production.(Information taken from 2014 GAIN – Annual coffee report 2014)

Exports include Coffee, khat, gold, leather products, live animals, oilseeds.

Coffee -

Gross domestic product

Ethiopia UK USA
GDP – real growth rate (2014) 8.2% 2.6% 2.4%
GDP – per capita: purchasing power parity (2014) $1,500 $37,700 $54,800
GDP – agriculture sector (2014) 47.7% 0.6% 1.6%
GDP – industry sector (2014) 10.4% 20.6% 20.7%
GDP – services sector (2014) 41.9% 78.8% 77.7%

Main industries

Food processing, beverages, textiles, leather, chemicals, metals processing, cement.

Main agricultural products

Cereals, coffee, oilseed, cotton, sugarcane, vegetables, khat, cut flowers, hides, cattle, sheep, goats, fish.

Main exports

Coffee, gold, leather products, oilseeds

Labour force by occupation

Ethiopia (2009) UK (2014) USA (2009)
Agriculture 85% 1.3% 0.7%
Government & services 10% 80.4% 41.8%
Industry & construction 5% 15.2% 57.3%

The World Factbook – Click here for source

Budget

Ethiopia UK USA
Revenue (2014) $7.582 billion $936.2 billion $3.029 trillion
Expenditure (2014) $9.025 billion $1.106 trillion $3.52 trillion

Economic aid received:

$3.2 billion (2012)
Click here for source

Currency

The Ethiopian Birr (ETB) exchange rates for US Dollars (USD), British Pounds (GBP) and Euros (EUR) are currently:


Currency data courtesy of coinmill.com.

Government

Country name

Federal Democratic Republic of Ethiopia

Chief of State

President Mulatu Teshome Wirtu (since 7 October 2013)

Head of Government

Prime Minister Hailemariam Desalegn (since 21 September 2012)

Flag_of_Ethiopia_(1996).svg

Elections

  • President elected by the House of People’s Representatives for a six-year term
  • Prime Minister designated by the party in power following legislative elections.

Parliament: two chambers

  • House of Federation or upper house – 108 seats
  • House of People’s Representatives or lower chamber – 547 seats

Present balance in Parliament

Election results (May 2015): seats by party – EPRDF 547

Ethiopian flag

Three horizontal bands of green, yellow and red with a yellow pentagram and single yellow rays emanating from the angles between the points on a light blue disk centred on the three bands.

The World Factbook – Click here for source

Transport

Ethiopia has one railway, built by the French at the beginning of the 20th century, which is 681km long. It links the capital, Addis Ababa, with the port of Djibouti at the bottom of the Red Sea, but is largely inoperable. (Railway is under joint control of Djibouti and Ethiopia 2015)

Ethiopia has a total of 44,349 km of highways of which 6,064 km are paved (2007).

Being landlocked, Ethiopia has no ports or harbours.  Since the disagreement with Eritrea, it no longer uses the ports of Massawa and Assab and now relies on the port of Djibouti for nearly all of its imports.

Ethiopia has a total of 57 airports, with 17 of these having paved runways (2013).

The World Factbook – Click here for source

People

Ethnic groups

Oromo 34.4%, Amhara (Amara) 27%, Somali (Somalie) 6.2%, Tigray (Tigrinya) 6.1%, Sidama 4%, Gurage 2.5%, Welaita 2.3%, Hadiya 1.7%, Afar (Affar) 1.7%, Gamo 1.5%, Gedeo 1.3%, Silte 1.3%, Kefficho 1.2%, other 10.5% (2007 est.)

Religions

Ethiopian Orthodox 43.5%, Muslim 33.9%, Protestant 18.5%, traditional 2.7%, Catholic 0.7%, other 0.6% (2007 est.)

Languages

Amharic, Tigrinya, Oromominga, Guaraginga, Somali, Arabic, other local languages, English (main foreign language taught in schools).

people

Ethnic groups

Oromo 34.4%, Amhara (Amara) 27%, Somali (Somalie) 6.2%, Tigray (Tigrinya) 6.1%, Sidama 4%, Gurage 2.5%, Welaita 2.3%, Hadiya 1.7%, Afar (Affar) 1.7%, Gamo 1.5%, Gedeo 1.3%, Silte 1.3%, Kefficho 1.2%, other 10.5% (2007 est.)

Religions

Ethiopian Orthodox 43.5%, Muslim 33.9%, Protestant 18.5%, traditional 2.7%, Catholic 0.7%, other 0.6% (2007 est.)

Languages

Amharic, Tigrinya, Oromominga, Guaraginga, Somali, Arabic, other local languages, English (main foreign language taught in schools)

Population matters

Ethiopia UK USA
Total population (2015) 99,465,819 64,088,222 321,368,864
Population growth rate (2015) 2.89 % 0.54 % 0.78 %
Birth rate (per 1000 population) (2015) 37.27 12.17 12.49
Death rate (per 1000 population) (2015) 8.19 9.35 8.15
Infant mortality rate (per 1000 live births) (2015) 53.37 4.38 5.87

Age Structure

Ethiopia UK USA
0-14 years (2015) 43.94% 17.37% 18.99%
15-64 years (2015) 53.17% 64.9% 66.13%
65 years+ (2015) 2.88% 17.73% 14.88%

Life expectancy

Ethiopia UK USA
Total population (2015) 61 years 81 years 80 years
Male 59 years 78 years 77 years
Female 64 years 83 years 82 years

Literacy

Age 15 and over who can read and write.

Ethiopia UK USA
Total population (2015) 49.1% 99% 99%
Males 57.2%
Females 41.1%

The World Factbook – Click here for source

Why Ethiopia?

You may also be interested to find out why we believe education is so important and why that’s our focus. You can also learn about Link Ethiopia’s approach to changing lives through education. How are we doing? You can explore our results, see our completed projects and hear from students who have benefited from our work. If you’d like to be part of this journey, get involved!